Visualizing Scientific Insights
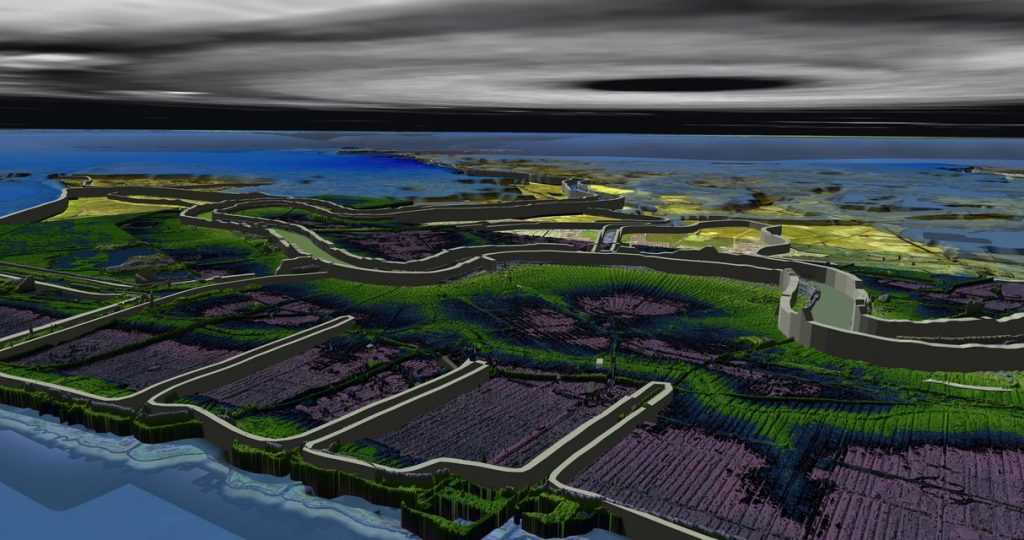
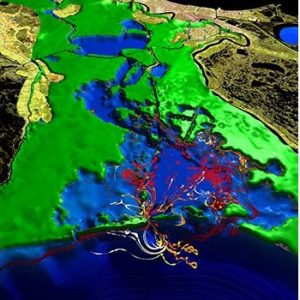
A frame from a movie illustrating flys into New Orleans LIDAR terrain over Lake Pontchartrain where the three drainage canals can be seen. This sequence was also rendered for the planetarium in Baton Rouge (source).
Scientific Visualization (SciViz) is a fascinating interdisciplinary branch of science. According to Friendly, it is “primarily concerned with the visualization of three-dimensional phenomena (architectural, meteorological, medical, biological, etc.), where the emphasis is on realistic renderings of volumes, surfaces, illumination sources, and so forth, perhaps with a dynamic (time) component”. It is also considered a subset of computer graphics, a branch of computer science. The purpose of scientific visualization is to graphically illustrate scientific data to enable scientists to understand, illustrate, and glean insight from their data.
In this post, I interview Dr. Werner Benger who describes his views on SciViz using Geometric Algebra and provides valuable insights about the use of SciViz in Big Data applications.
Basically, there are three purposes of visualization of scientific data:
- Presentation (when all is known about the data),
- Analysis (when some questions need to be answered about the data),
- Exploration (when we have no clue about the data yet and want to find out something new).
Although user interface design is not necessarily part of SciViz, but in many cases, interactivity is needed. Particularly important is that the data that one deals with here are those with a spatio-temporal nature, it’s not just “any” data, but this specific subset.
Actually, I would not say that I have chosen to work in SciViz. It’s more that SciViz has chosen me. For most of the time I’ve considered myself rather an astrophysicist that became “delinquent” by engaging with computers too much. The origin came from the question how a black hole actually looks like. I asked that questions to one of my professors at university and he could not answer it, so I had to find out myself. I wrote a computer program for that purpose and that got me into this field. A couple of years ago I gave a presentation to students telling this story, you can find the presentation slides here.
As you mention Engineering vs. Computer Science – I often feel the difference between these two is that in Engineering you worry to get things to work “somehow”, while in Computer Science you also worry how things are getting to work and you want to find a systematic, future-safe approach. I’m myself more behind this theoretical approach to finding a powerful general solution that also but not only works for a special case, rather than just solving one particular special case. I also want to know why things work or why things cannot work, rather than finding an algorithm that solves a problem “somehow”.
My own approach to scientific visualization is focusing on finding general methods that allow encapsulation and reuse of code and algorithms. Computer programmers are inherently lazy people; otherwise, they would not use computers. I’m no exception for that, and particularly lazy such that I want to implement an algorithm or data operation once, and not over and over again for similar data types. Consequently what is needed is one common concept that covers many cases under the same hood. I found that to be true through my background in astrophysics in General Relativity (GR); since this theory makes many otherwise implicit assumptions explicit.
The same is also true about Geometric Algebra, which “unfolds” otherwise collapsed mathematical entities, such as vectors and bivectors, and clearly states the properties of each object in a systematic way. So it is this unfolding and clarification of concepts via GA and GR (namely differential geometry and topology) that opens the path to a common data model that is powerful and reusable for those many cases that one encounters in scientific visualization. It is an overhead for a particular case, so many people who do their work under time-pressure or a close horizon don’t see the benefit of a more general data model, but in the longer term it is significantly less work and opens development resources towards more interesting topics rather than dealing with myriads of similar cases. Here is an article titled “On Safari in the File Format Jungle” that elaborates on this matter.
Systematic scientific visualization fuses all those interesting mathematical fields of differential geometry, topology, and geometric algebra. SciViz is also on the bridge between artwork and science, so touching both aspects is what many want, but only SciViz achieves if done well. You can read more about this aspect in my article “Visions of Numerical Relativity 1999“.
Concerning new developments – that is certainly “Big Data”, which has become a buzzword that is all around now. With more and advanced numerical and observation technology available, the trend is to no longer filter data during generation, but to just retrieve and store anything possible, leaving the crucial problem of identifying – i.e., visualizing – the important aspects of the data to the last data processing step, the visualization. This is a topic by itself of course, but just to mention that Big Data is often considered synonymous with High-Performance Computing (HPC). Actually, SciViz only covers one aspect of HPC, but indeed many methods and approaches from HPC are needed to deal with SciViz, even on single PCs and laptops. There it is of course all about parallelism, about GPU computing, about parallel I/O, and about scaling up algorithms to deal with bigger amounts of data.
Geometric Computing is a tool that is used in SciViz to solve its various detail problems. It’s frequent that in SciViz you want to achieve something and you need to search for the best GC algorithm to solve it. For the other way around, SciViz may help to develop a GC algorithm as it allows visual insight to what actually happens during the algorithm, not merely the result.
I always try to solve a GC problem via GA since GA is much richer in expressiveness than linear algebra and the chances that a seemingly complex algorithm can be solved by some simple but powerful elements taken out of a GA “toolbox” are high. Once you are used to thinking in terms of GA, things become easier that way, and thinking in terms of linear algebra feels like a knot in the brain. Like when talking about a “normal vector”, which is not really a vector, it’s merely identified with a vector, but what is actually a better representation is a bivector algebraically describing a plane’s direction in space.
This sometimes leads to passionate discussions with colleagues who still think about geometry in linear algebra and wonder how to rotate around an axis in 3D, when it’s so much easier to think about a rotation in a plane spun by two vectors. Such GA-based representation does not require any thinking, you “just do it”. But it is so hard for people to think about a bivector when talking about a plane if they are used to think about a plane’s normal vector instead, which in fact is a construct involving orthogonality and orientation, much more complex than the original object, the plane itself.
But then, even GA complicates matters by considering bivectors as oriented planes, but there’s not really a concept of a plane “as-is”, i.e. without orientation. That is something that can be borrowed from differential geometry as a covector, an unoriented plane, which by means of using an orientation (via the pseudoscalar) is identifiable with a bivector, then describing an oriented plane. And all those items are identified in linear vector algebra with the same object, a three-component vector.
Now it’s a bit of matter of taste which side is more confusing, the one identifying different geometric concepts into the same algebraic representation, or the one that unfolds a widely used geometric concept into more expressive algebraic objects. For my taste, the latter, and the more you have unfolded those geometric concepts, the better you understand which algebraic structures are required for identification – and those structures may be non-trivial in general, thus need to be considered explicitly in a general-purpose data model, even though via various optimization techniques they would vanish. This should be the last step, not the first one. “Implicit assumptions” are the death of data descriptions and file formats, there must at least be a way to identify which assumptions have been made, and they need to be part of the data description.
When we classify algebraic properties of geometric concepts we obtain a “zoo” of vector types. This determines the metadata that needs to be written to a file (or other means of persistent storage such as a database) such that the data remain identifiable. Just writing floating point data is simple, but problems occur when the need arises to know what the data mean when reading them. Self-description of data is important for archival purposes and restartable algorithms, which are particularly important for long-term archiving and out-of-memory data processing. There are not many file formats that even provide the required expressivity of meta-data as required for this purpose to describe such variety of vectorial types.
XML is one option, especially in the web context, HDF5 is another one, designed for high-performance applications and big data. While via XML anything is in the open, in HDF5 there already is an API to describe the properties of types. In Addition, HDF5 provides functionality of type conversions, which in this context can be utilized to e.g. implicitly convert multivectors of different numerical precision or to read a partial multivector into full multivector (for instance, if data were written by an application that only knows about vectors, but later on these data are read into another application that only knows about full multivectors).
For a generic application, we need runtime type identification that maps a type description, may it be provided by HDF5 or another capable file format \ storage medium, into compile-time types such that the correct precompiled code for the respective vector types can be called. On the other hand, the I/O mechanisms should not need to know about the complexity of vector types, it only needs to know about arrays of floating points plus some metadata. Thus what is left is to map the compile-time type meta-information to some run-time meta-information about types. The mechanism of type traits comes into play here for writing data. For reading data, however, it is not sufficient. When a certain data type is identified in some persistent storage, the reading code has to look up some registry to find a routine that produces actual instances of data arrays of the given type (which is then known by application code only). Given such an application code produced data array, it remains sufficient for the reading code to look at its numerical values only.
Well, in theory, it’s a complementary part of simulation; in practice many scientists performing 3D or 4D simulations still only look at numbers or 1D plots. This is partly due to “old-style” scientists being used to 1D plots, as this was the only way of “visualization” decades ago, and color printing of images with 3D visualizations is not possible in traditional high-profile journals where they want to publish. The other problem is the inconvenience of dealing with big data and advanced visualization systems. While there are lots of fancy visualization equipment such as Caves and Walls, only very few would make use of such. The typical scientist would not make use of anything that doesn’t run on their laptops right away. Even going to another room for doing visualization on a higher-end machine is too much overhead for many “end-users” and they would not do it unless they are forced to.
For design and engineering of SciViz software, I’m an advocator for using a common data model. I.e., use one central data structure to route as many types of data through this one, instead of cooking many little solutions that may or may not fit together.
Concerning code readability, I believe code should be written in a most intuitive way; mathematical algorithms as close to the mathematical notation as possible. For example, operator overloading and C++ 14 string literals provide syntactic sugar to do so, but a naive implementation may suffer performance issues. Expression templates have demonstrated how human-readable code can be transformed into efficient code by using C++ templates. The more constraints are known about some code, the better it can be optimized, and systems such as Gaalop or GMac that rely on symbolic algebra packages may be able to optimize a certain algorithm even better than the more generic C++ compiler. It is thus desirable that a C++ library providing GA algorithm allows for application code that is not only human-readable but also readable as a domain-specific language such that it is parseable by tools beyond the C++ compiler itself.
GA is as helpful here in software design as it is helpful in bridging different mathematical applications, by showing a common, unifying basis. The difficulty here is similar to using a common data model: we need the most general possible way of considering GA, not merely a version of GA for one particular case, even though that one may be very broadly used.
For instance, this means considering GA in arbitrary coordinate systems, not merely in orthonormal coordinate systems, which is what most implementations of GA do – because mathematically, it can be done, and the problem is solved thereby. But it’s only mathematically solved, and in practice, non-orthonormal coordinate systems are more common; for instance in numerical relativity or in computational fluid dynamic simulations. GA-based implementations need to be as general as possible to cover all such applications that can use GA as an algebraic representation. At the same time, we need to keep the highly optimized reductions that are possible for special cases, and at this time some automatic code generators may come into play to allow specifying constraints and knowledge available for a particular use case (e.g. global orthonormality of coordinates) which are not available on the level of a compiler.
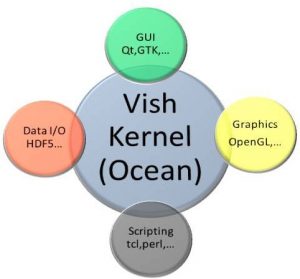
A certain difference is that one must avoid any overhead “per vector element” and consider doing operations on “arrays of multivectors”. This comes with constraints that need to be taken into consideration. Vish stems from a background of dealing with big data from numerical relativity and bases all its data operations on the concept of fiber bundles. This means operations are done as array operations as much as possible, which are parallelizable and allow optimal data throughput, for both I/O and transferring data on the graphics card for rendering. Modern rendering is based on vertex buffers and vertex arrays, which mathematically are fiber bundles, whereas the old OpenGL 1.0 was about primitives and lists of primitives. This model did not scale to the highly parallel data processing that happens on GPUs and thus is considered deprecated now, whereas the fiber bundle data model, envisioned originally by D. Butler in 1989, shines, even though only a few people are aware that they actually do fiber bundles.
In this context, GA is complementary, as it basically implements fibers on the fiber bundle data model. So the basic change is to think about operations on arrays of multivectors and to extend solutions to consider array operations instead of single variables. Now that “should” be rather easy when an array of multivectors is homogenous, i.e. each array element consists of multivectors with the same zero and non-zero components. Fortunately, this will most likely be the case in practical applications, and code-generators such as GMac are able to predict which multivector components will always be zero within an algorithm – that is an essential part of applying GA algorithms for big data, both for computational speed and even more memory consumption.
For a single input operation, optimizing out zeroes is just some computational optimization, but the algorithm would still work without it. For big data having many inputs, keeping arrays which are all zero are performance killers and may prevent an entire application from becoming functional. So an optional optimization for small data applications becomes a mandatory component for big data applications. But things become really complex if we had to consider heterogeneous multivector arrays where the zeros would be different at each array element. This basically leaves us with two options: Carry all zeroes everywhere for the sake of parallelism, or use locally dynamic multivectors, which will be much slower but more memory-friendly. Let’s hope we don’t have many such application cases.
I would like to point out that Vish is adhering to a particular license with a non-military aspect. I think it’s important for developers of technology to also think how their technology can be used. Otherwise, the Oppenheimer effect may strike them later on. Many people would object, and promote “free software” just for the sake of freedom, saying the military would not respect a software license anyway. However, my experience on that matter has been just the opposite. It is respected, and I had a couple of requests from the military that I was putting down, and it was accepted.
This is a good and unsolved question. Actually, I don’t think much can be done to change the mind of current researchers, but new ones will embrace new technology in a natural way, similar to kids growing up with smartphones, while their grandparents still disapproving them. Parts of the process is due to the technology not just becoming functional, but also easy and available to use.
There is not much point of trying to “force” users into some technology, that is not really sustainable, but there are many people out there that would want to make their technology to be used and available, yet they struggle with the simple issue of obtaining funding for it, because in the scientific world, you don’t get papers and publications for making your software easier to use. It’s more the scientific publication culture, or rather, using “scientific publications” as a measure for funding agencies that inhibits making such tools easier. SciViz, in particular, has the problem that everyone wants and likes glossy images to present and sell their work, but hardly anyone wants to invest resources into it or pay for it. There are few exceptions, for instance, I heard about research centers with the policy that 10% of all project budgets must be allocated for doing visualization; this is a great model. By that model, even projects that don’t need visualization contribute to visualization research and deployment. With a proper funding model for SciViz development and supplementing, development and increased use of advanced SciViz tools will come naturally.
On the other hand, GA is more an educational topic, it does not really help to understand a data analysis in its entity, it could only help to understand a certain data analysis tool or method, to see what it does. But understanding the data itself is independent, and that is up to the scientist who produced the data to determine whether GA is of benefit in this step. But similar to SciViz tools, there is no point of trying to enforce or promote GA to those who don’t want it, but those who don’t know it yet should be made aware that it exists and what it is good for, and that should be done as early as possible in someone’s learning career. Of course, the problem is that it comes with a choice – it can be used or not, so to not burden people with unnecessary mental ballast, it would not be taught early on. But at least, it should be mentioned, so people inspired by it can look it up themselves.

